A Myfxbook link proves nothing on its own. A green verified tick and a 500% gain chart can still hide an account one bad week away from a margin call. The balance curve goes up — but equity tells a completely different story. The win rate is 91%, but the average loss is four times larger than the average win.
After 10 years of running live forex EAs and evaluating hundreds of Myfxbook statements before putting real capital behind any system, I have built a checklist that goes beyond the headline numbers. This guide covers every step of that process, from verification status to the CSV trick that reveals the hidden drawdown your dashboard number deliberately obscures.
Step 1: Verification Status: What It Confirms (And What It Does Not)
The first thing to check on any Myfxbook statement is the verification badges displayed at the top of the account page. Myfxbook uses two separate verification components — and they confirm very different things. Most traders assume one green tick means the account is fully verified. It does not.
The Two Verification Components
Myfxbook verification is split into two independent checks, each with its own badge:
| Badge | What It Verifies | How It Works |
|---|---|---|
| Track Record | The trading history shown on Myfxbook matches the actual account history provided by the broker on the trading platform. | Requires valid account number, investor password, correct broker, and correct broker server. Myfxbook reads the account with read-only access. |
| Trading Privileges | The person who added the account holds the master password — confirming actual ownership and the ability to execute trades. | Achieved by either changing the investor password via MT4/MT5 to a Myfxbook-generated code, or placing a pending order with the code in the comment field. |
A fully verified account shows both badges as green ticks. When you are evaluating an EA or trader’s statement, check both — not just one.
What the Badges Look Like in Practice
Looking at real Myfxbook accounts, the badge states are immediately visible below the account name. Here is what each combination means in practice:
Example 1 — FX JetBot EURGBP (partial verification): Track record shows a grey exclamation mark — unverified. Trading privileges shows a green tick — owner confirmed. This means the trade data has not been independently confirmed against broker records. The account owner is real, but the history itself is unverified. Do not rely on this statement for performance analysis.
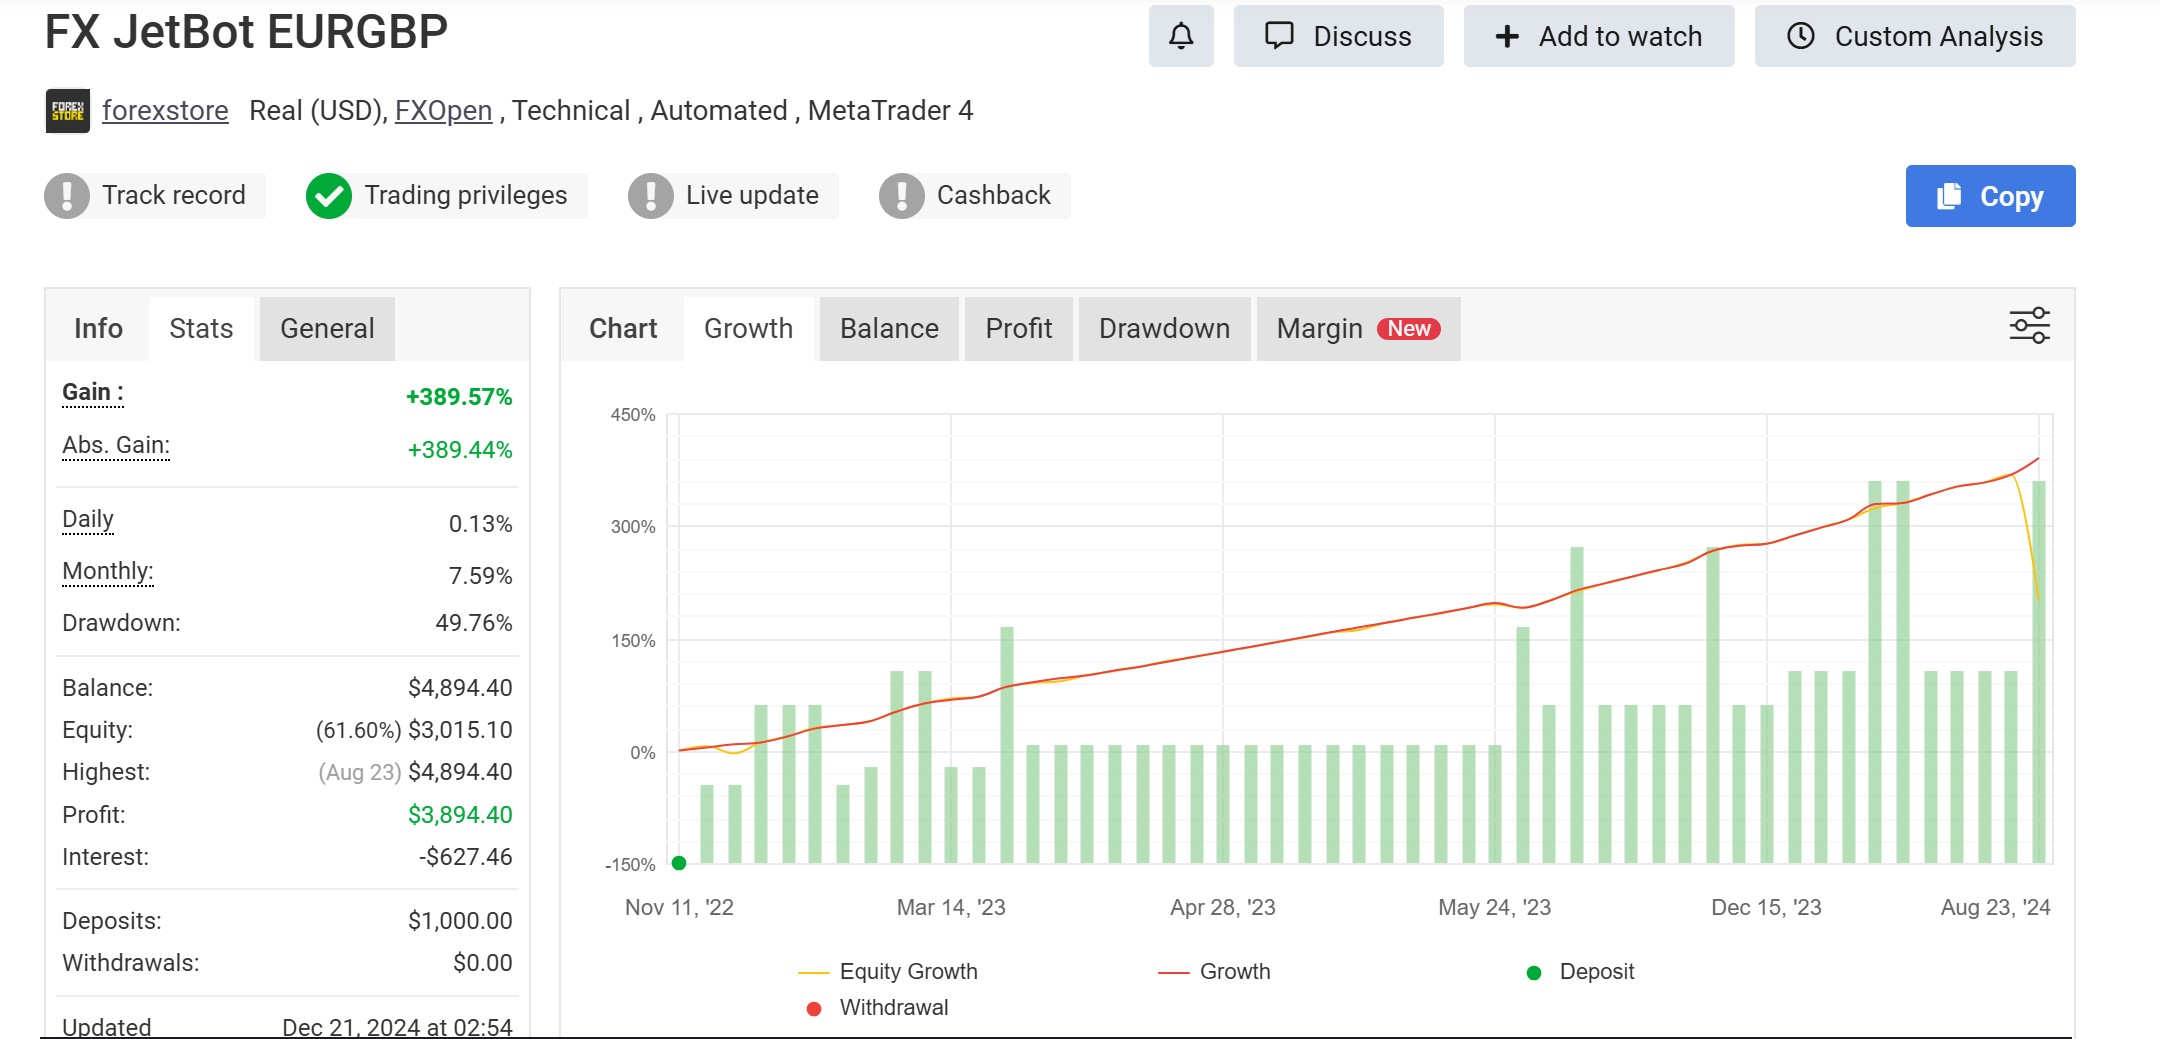
Notice also: Balance $4,894.40 vs Equity (61.60%) $3,015.10 — a $1,879 floating drawdown representing 38% of the real account value. The gain chart looks positive. The real account is in significant open loss. This is exactly why verification status and the balance/equity gap must be checked together. (More on this in Step 2.)
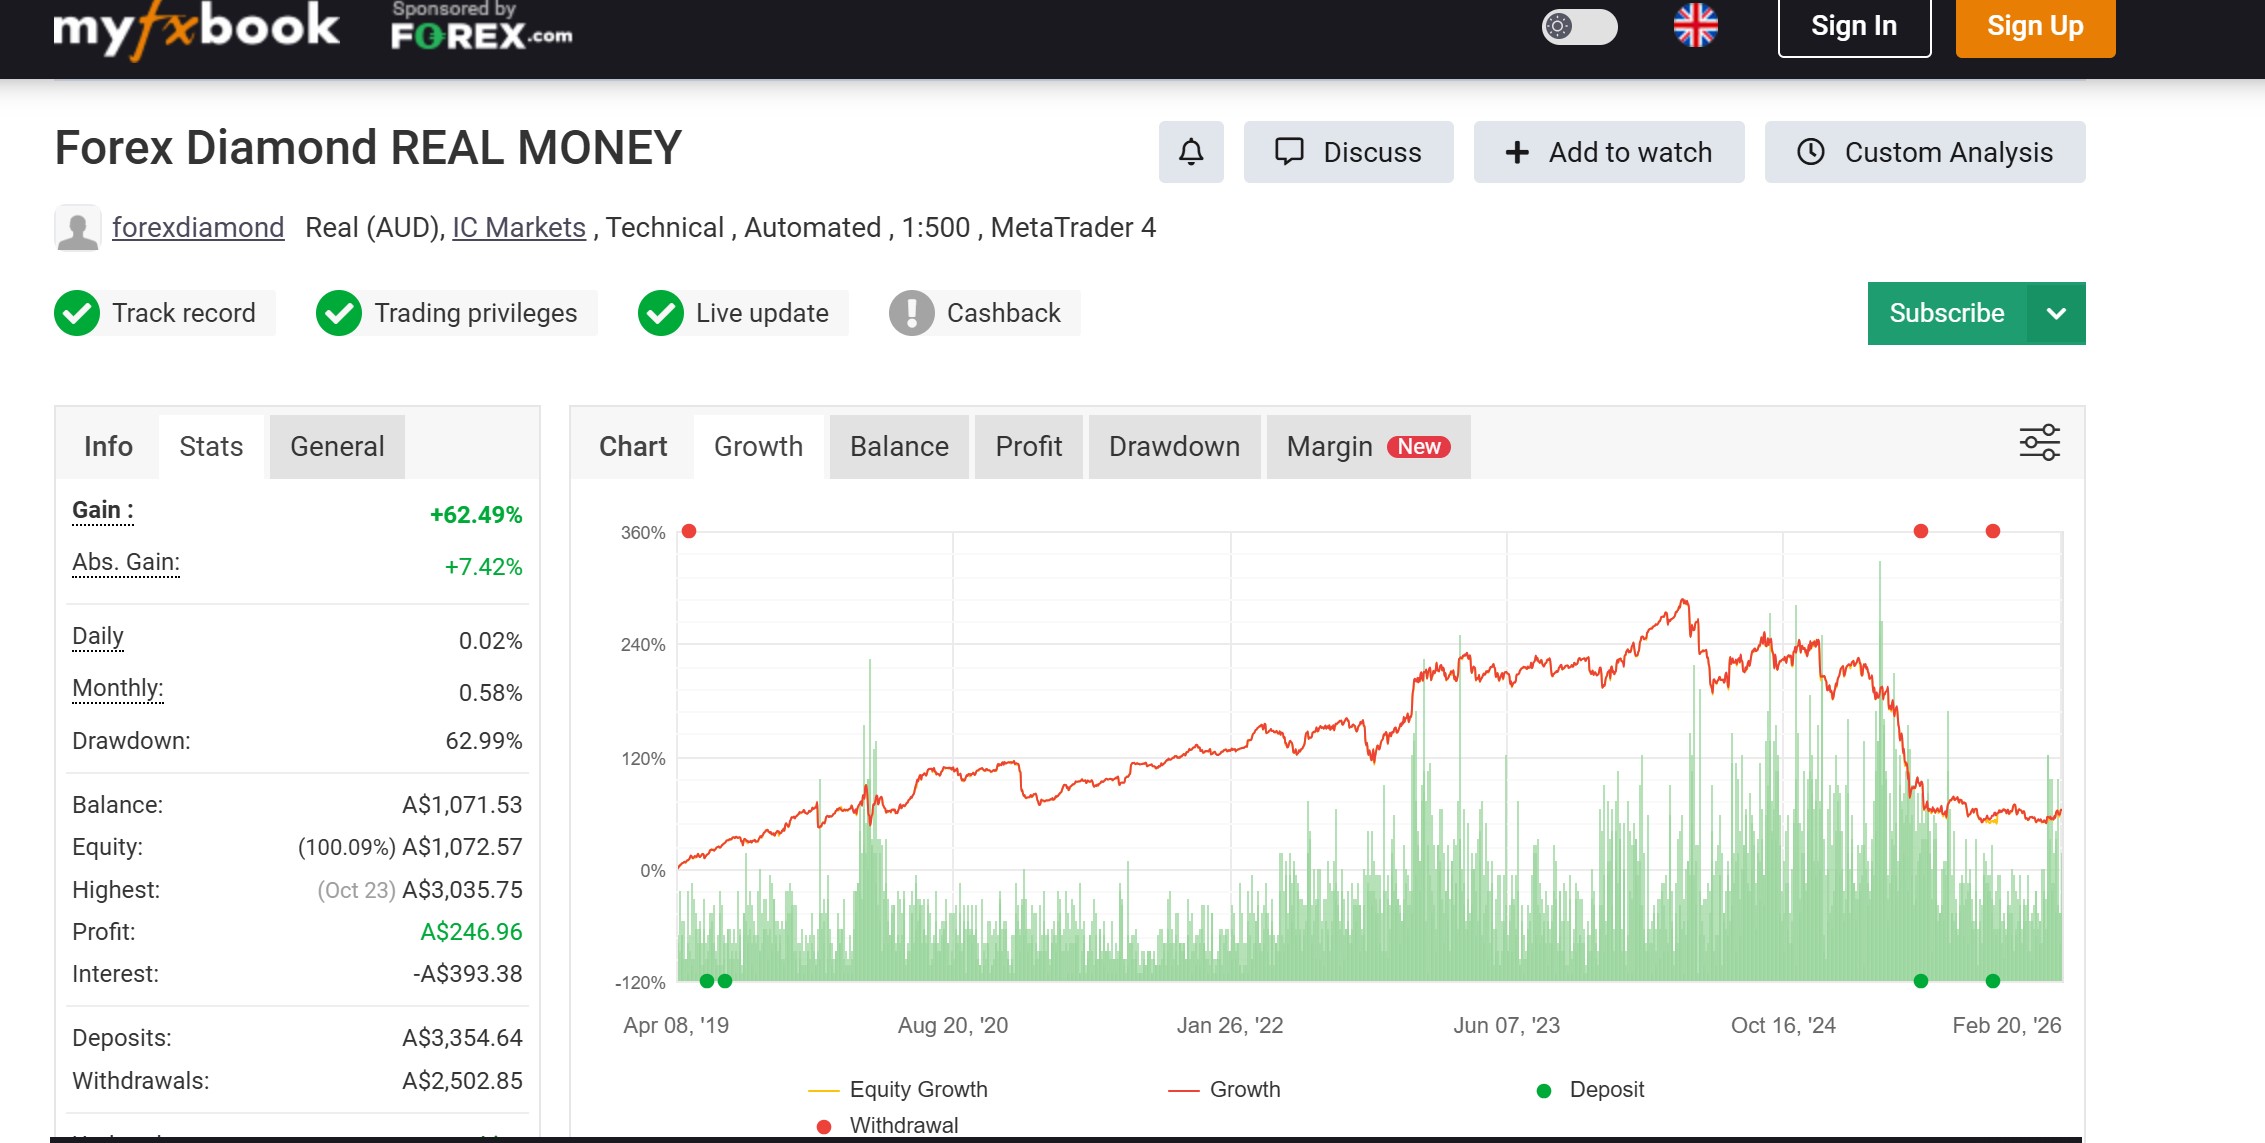
Example 2 — Forex Diamond REAL MONEY (full verification, AUD account): All three primary badges are green — Track Record, Trading Privileges, and Live Update. Account is Real (AUD), IC Markets, MT4. Important: the account is denominated in AUD, not USD. The gain of +62.49% and profit of A$246.96 on A$3,354.64 in deposits looks modest — but the 62.99% drawdown is a critical red flag visible immediately from the info panel.
Verification Status Summary — What to Look For
| Badge Combination | What It Means | Proceed With |
|---|---|---|
| Both badges green + Live Update green | Full verification. History confirmed by broker. Owner confirmed. Data live. | Full analysis — this is the standard to expect |
| Both badges green, Live Update grey | History and ownership confirmed, but data may be stale between syncs. | Proceed with caution — check “Updated” timestamp |
| Trading Privileges only (Track Record grey) | Owner confirmed but history NOT independently verified against broker records. | Treat history as unconfirmed — do not use for performance decisions |
| No badges green | No verification at all. | Disregard entirely |
Additional Red Flags at This Stage
- Account type “Demo” — Demo accounts face no real slippage, no real margin calls, no swap costs, and no psychological pressure. Demo performance does not transfer to live trading under any circumstances.
- Cent account denomination — A cent account where $100 represents 10,000 cents makes percentage gains look dramatically larger than real dollar exposure. A 300% gain on a $100 cent account is $300 in real money — not the number it implies at scale.
- Open trades hidden or private — There is no legitimate reason to hide open positions on a public performance statement. Hidden open trades almost always conceal a large floating drawdown the account owner does not want visible.
- “Updated” timestamp is days or weeks old — Especially critical for gold EAs running in volatile market conditions. A statement last updated 3 weeks ago tells you nothing about the current account state.
The critical point remains: verified means the data is authentic — not that the strategy is safe. A fully verified account with both green badges can still be a Martingale system sitting on a 60% floating loss that has not yet hit balance because no losing positions have been closed. Verification confirms the data is real. Everything else requires the analysis that follows in Steps 2 through 8.
For a broader view of how verified accounts are still used to mislead traders — including the IB affiliate pattern where cherry-picked Myfxbook links are used to promote EAs — see are forex robots legit.
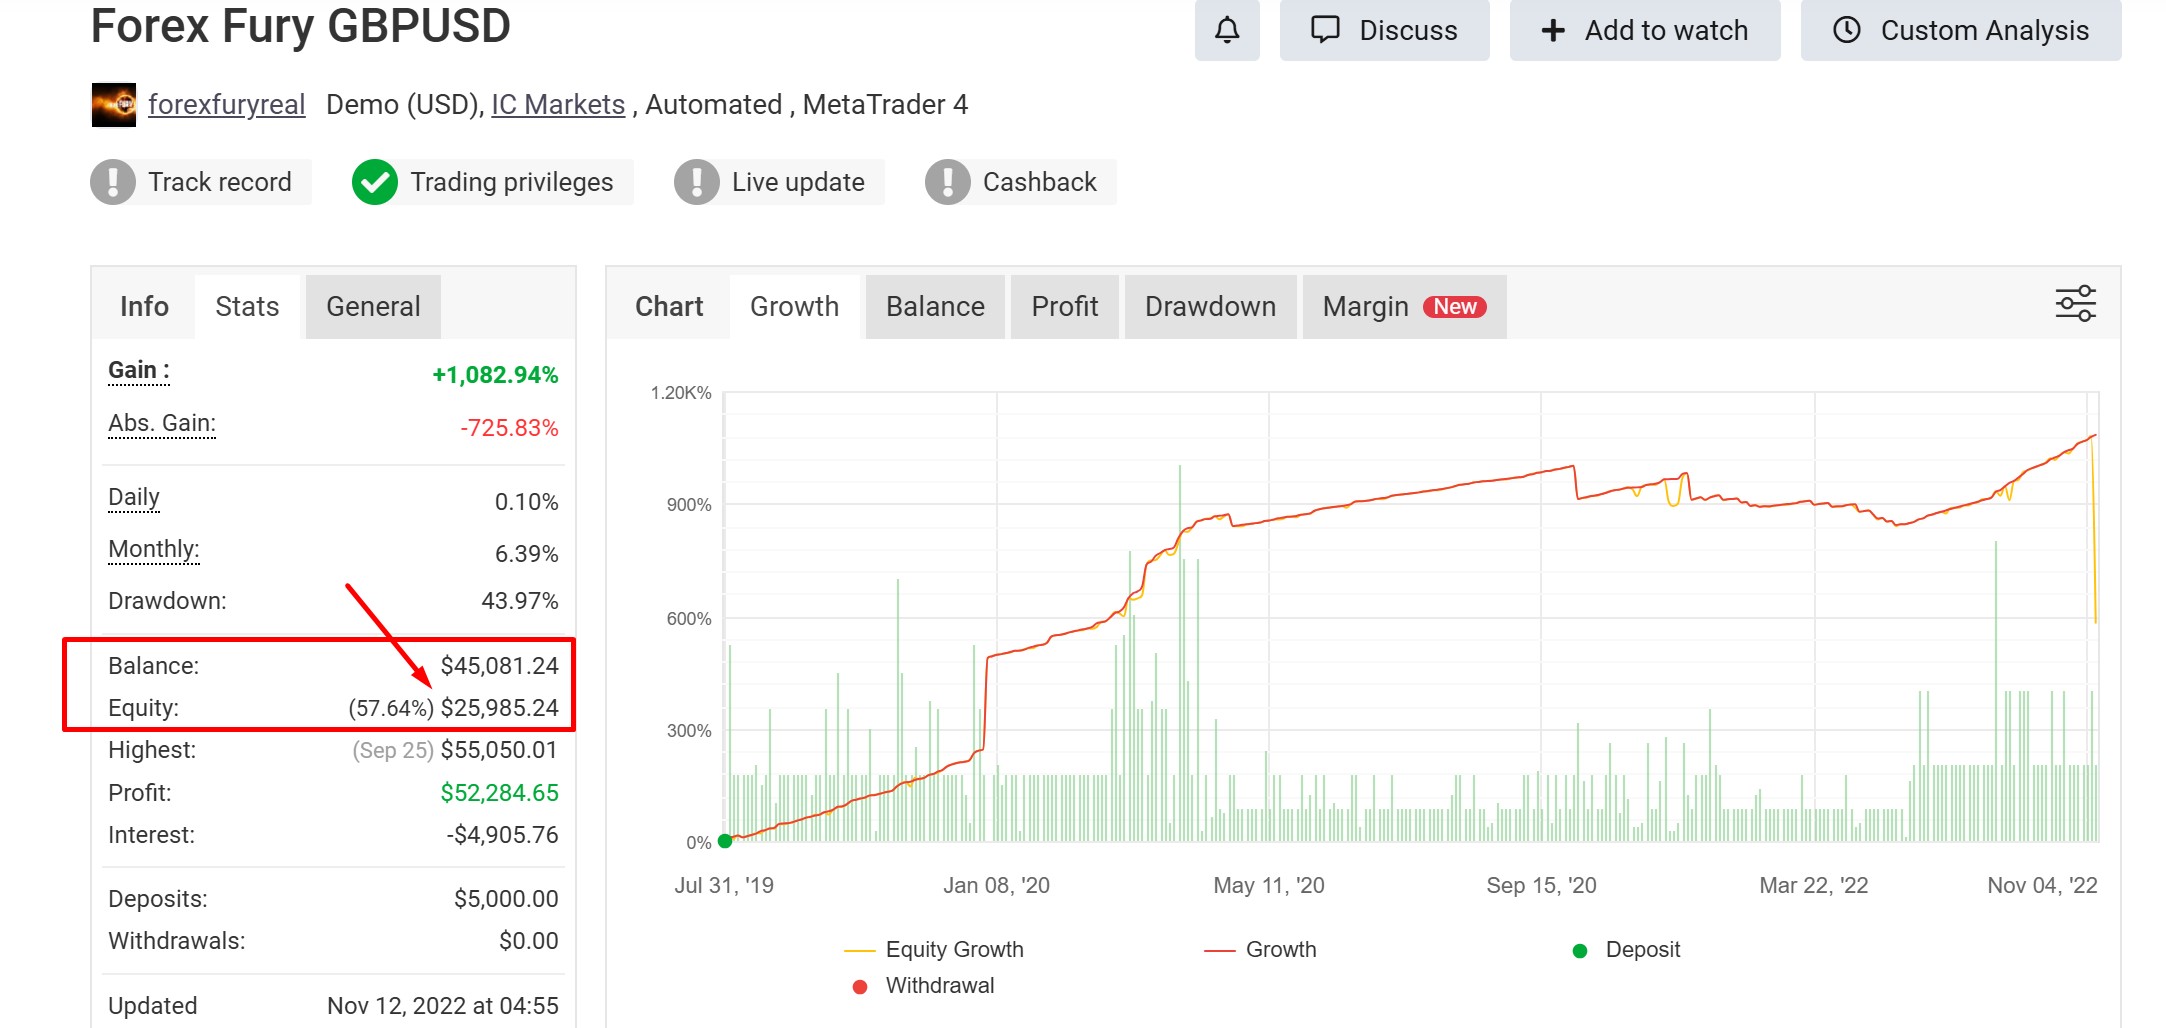
Step 2: Balance vs Equity: The Most Important Number Most Traders Never Check
These two numbers appear side by side on the Myfxbook dashboard. Most traders glance at balance and move on. That is a mistake.
| Metric | What It Includes | When It Updates |
|---|---|---|
| Balance | Only closed trades. Does not include open positions. | Only when a trade closes |
| Equity | Balance + current floating P&L of all open trades. | Continuously, in real time |
Equity is the real account value. Balance is a partial picture.
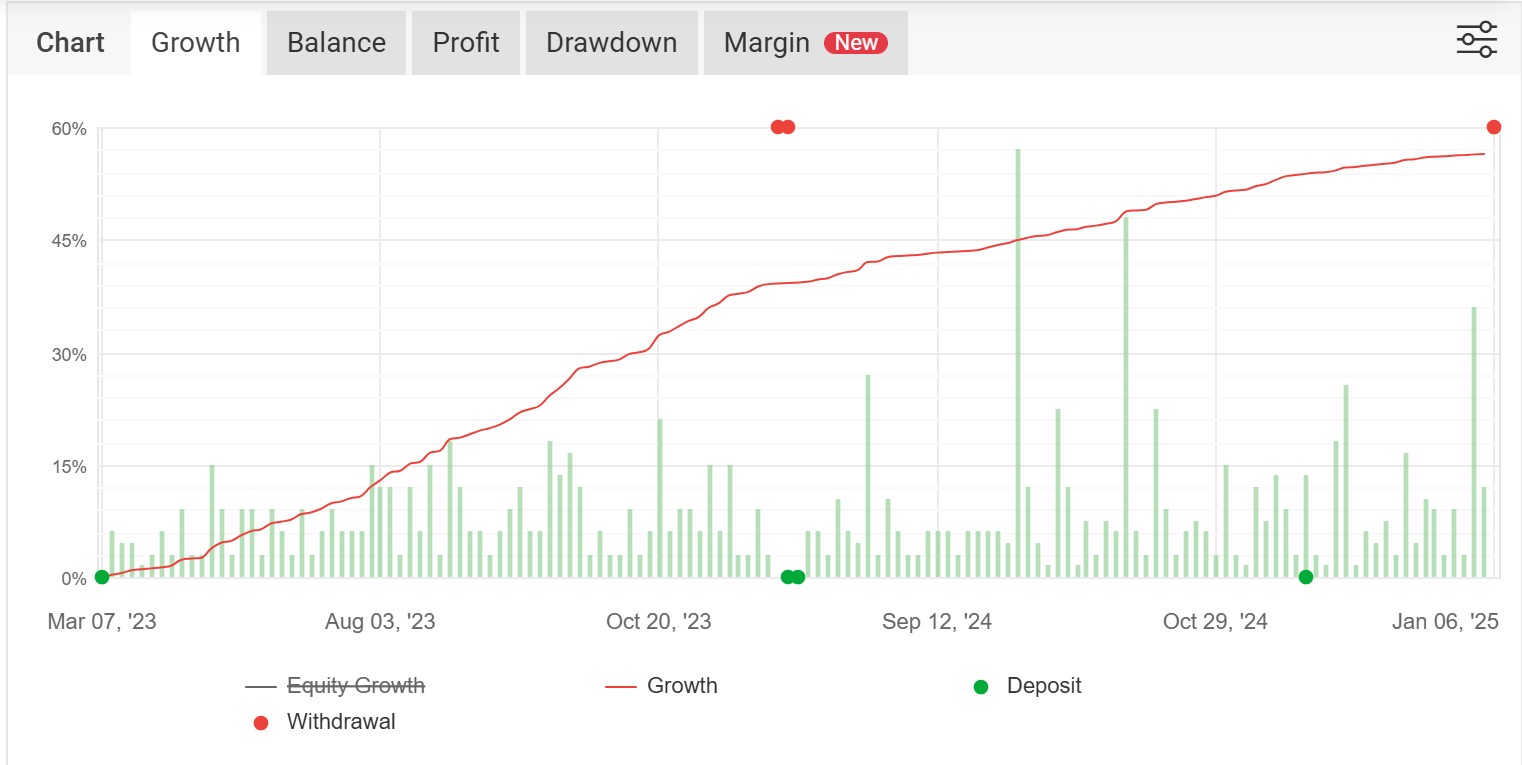
A rising balance with equity significantly below it means the account is holding open losing positions and refusing to close them — keeping the balance curve clean while real exposure compounds in the background.
Example: An account shows Balance $12,000 and Equity $8,400. That $3,600 gap is not a rounding difference — it is $3,600 currently in open losing positions, representing 30% of the real account value. If those positions close at their current level, balance drops to $8,400 immediately. The “500% gain” chart stays intact right until it does not.
This is exactly why the best gold forex robot comparison shows equity data separately from balance — and why any EA whose Myfxbook page does not display live equity data should be treated with significant caution.
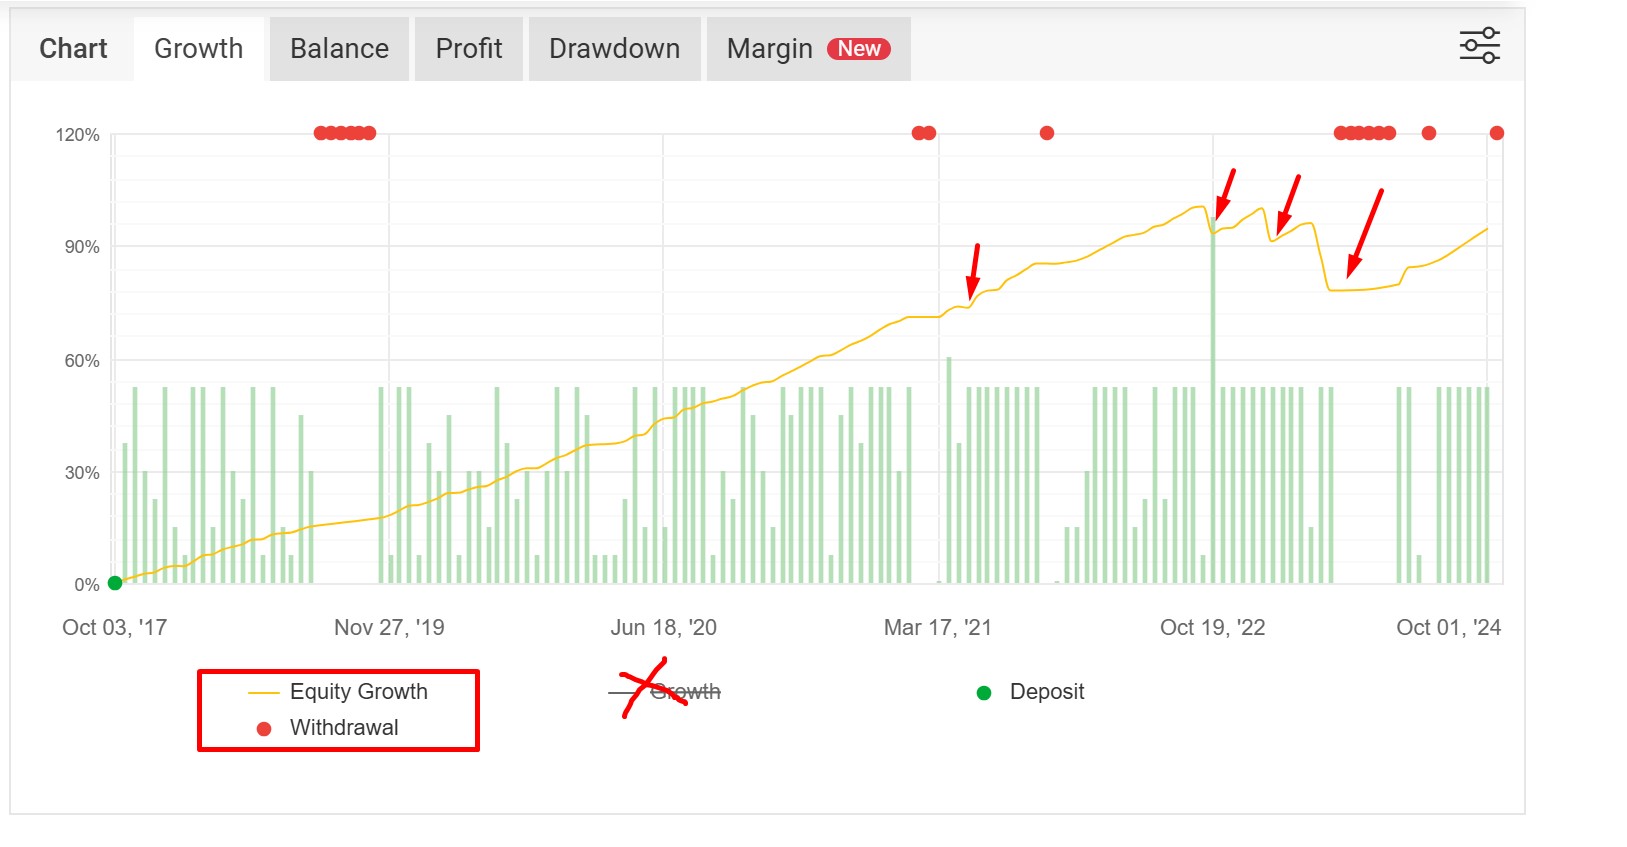
Step 3: Reading the Equity Curve Shape
Most traders look at the equity curve and ask one question: is it going up? The right question is: what shape is it? The shape reveals the risk architecture of the system more clearly than any single metric.
Jagged / Irregular Curve => Healthy Signal
A curve with visible ups and downs, drawdown periods that recover naturally, and no extended flat sections indicates a system that closes both winning and losing trades at market pace. Losses are taken when they occur. The equity reflects reality continuously.
Perfectly Smooth Upward Curve => Red Flag
A smooth curve with almost no visible drawdown is not a sign of exceptional skill. It is almost always a sign of a grid or Martingale system where losing positions are held open indefinitely rather than closed. Because those losses do not close, they do not appear in balance. The curve looks clean. The real equity — if open trades were visible — would show a very different picture.
The smooth curve does not mean the system will fail. It means the risk is deferred, not absent. When a grid system’s open exposure finally exceeds available margin, the account closes instantly — and the smooth curve ends with a vertical drop to zero.
Stair-Step Pattern=> Investigate Further
Flat periods followed by sudden upward jumps indicate an EA that only trades in specific conditions. This can be a legitimate range-bound strategy. But flat periods can also indicate that open losing trades are being held while no new winning trades close — keeping the balance flat until the grid or hedge basket eventually resolves. Cross-reference flat periods with the open trades history to distinguish the two.
Step 4: Profitability Metrics: Read Them Together, Not Individually
Myfxbook displays win rate, profit factor, expected payoff, and average win/loss in the Trading tab. None of these numbers means anything in isolation. They only tell the truth when read together.
Win Rate
The percentage of trades closed with a profit. A high win rate — 85%, 90%, 95% sounds impressive. But a system that wins 90% of trades and loses 10× on the losing 10% has a negative expectancy. It is a losing strategy with a flattering win rate. Win rate without average win/loss context is meaningless.
Profit Factor
Total gross profit divided by total gross loss. This is a more complete picture than win rate alone because it incorporates the size of wins and losses, not just the frequency.
- Below 1.0 — losing strategy
- 1.0–1.3 — marginal, needs long track record to confirm
- 1.3–1.5 — viable, acceptable for most strategies
- Above 1.5 — strong
- Above 3.0 on a short track record — suspicious. Likely curve-fitted or insufficient sample size.
Average Win vs Average Loss (Risk/Reward Ratio)
The most practical metric for understanding long-term survival. If average win is smaller than average loss, the system needs a very high win rate just to break even. If average win is 2× or 3× average loss, the system can be profitable even with a win rate below 50%.
The question to ask: Can one average win cover multiple consecutive losses? If the answer is no, the system is fragile under any losing streak.
Expectancy
Expectancy = (Win Rate × Average Win) − (Loss Rate × Average Loss). This single number tells you the expected profit or loss per trade over a large sample. It must be positive for any system to be viable long-term. A positive expectancy with a consistent track record is the foundation of a trustworthy Myfxbook statement.
[IMAGE: Myfxbook Trading tab screenshot — Win Rate, Profit Factor, Expected Payoff, Average Win, Average Loss — annotated with callout labels explaining each]
The following table shows three EA profiles to illustrate how the same win rate can produce completely different risk outcomes depending on the other metrics:
| Profile | Win Rate | Profit Factor | Avg Win / Avg Loss | Expectancy | Verdict |
|---|---|---|---|---|---|
| EA A | 88% | 1.1 | 0.5 : 1 | Marginal | ⚠️ Fragile — one losing streak destroys months of gains |
| EA B | 55% | 1.6 | 2.2 : 1 | Strong | ✅ Solid — can absorb losing streaks comfortably |
| EA C | 72% | 2.1 | 1.8 : 1 | Strong |
Step 5: Drawdown Analysis: Beyond the Headline Number
Maximum drawdown is the most quoted risk metric on Myfxbook. It is also the most commonly misunderstood — and for grid and Martingale systems, it is deliberately incomplete.
What the Dashboard Drawdown Number Shows
The maximum drawdown percentage on the main Myfxbook dashboard represents the largest peak-to-valley decline in balance from closed trades. It does not account for floating losses on open positions that have not yet been closed. For systems that hold losing trades open for days or weeks, this number can dramatically understate real risk.
Balance Drawdown vs Equity Drawdown
Myfxbook also tracks equity drawdown separately in the drawdown chart. The gap between the two lines tells the real story. A system showing 8% balance drawdown with 35% equity drawdown at the same time period is a very different risk profile from one where the two lines track closely together.
The CSV Trick — Finding True Drawdown Per Trade
This is the most useful analytical step most traders never take. Myfxbook allows you to export the complete trade history as a CSV file. Inside that file is a column labelled Min(USD) or Minimum USD — this shows the deepest negative point each individual trade reached before it was eventually closed.
A trade that closed at +$15 profit may have been at −$180 at its worst point during the holding period. That −$180 never appeared in the balance drawdown because the trade ultimately closed in profit. But it represents real capital that was at risk at that moment — and if the account had hit a margin call threshold during that period, the trade would have closed as a loss.
How to use the CSV trick:
- On the Myfxbook account page, navigate to the Trading History tab
- Click Export → Download as CSV
- Open the file in Excel or Google Sheets
- Find the Min(USD) column
- Sort by this column to identify the worst individual trade drawdowns
- Compare the deepest Min(USD) figures against the account balance at that time — this gives you the true maximum floating drawdown percentage
Drawdown Recovery Math
A key fact many traders ignore: the percentage gain required to recover from a drawdown is always larger than the drawdown itself, because the recovery is calculated from a smaller base.
| Maximum Drawdown | Risk Profile | Gain Required to Recover |
|---|---|---|
| Under 10% | Conservative | ~11% |
| 10–20% | Moderate — most professional EAs target this range | 11–25% |
| 20–30% | Aggressive | 25–43% |
| 30–50% | High risk — most retail traders cannot hold through this | 43–100% |
| Above 50% | Critical — account survival is the primary concern | 100%+ required |
Use the forex position size calculator to ensure your account has sufficient balance headroom above the EA’s expected maximum drawdown before deploying any live capital.
Step 6: Detecting Grid and Martingale Systems
Myfxbook does not label an EA as “Martingale” or “grid.” You have to identify it yourself from the trade data. This matters because grid and Martingale systems carry a fundamentally different risk profile from standard trend-following or range EAs — and that risk is not visible in the headline metrics.
Four signals in the Myfxbook trade history identify these systems:
Signal 1 — Multiple Trades Closing at the Exact Same Timestamp
When a grid basket closes, all positions in the group close simultaneously. Look at the trade history and filter for trades that share identical close times down to the second. A cluster of 5–10 trades closing at the same moment is almost always a grid basket resolution.
Signal 2 — Increasing Lot Sizes as Price Moves Against the Position
In the trade history, sort by open time and look for sequences of trades in the same direction where lot sizes follow a doubling or multiplying pattern: 0.01 → 0.02 → 0.04 → 0.08. This is classic Martingale position averaging. The strategy recovers from a losing sequence by doubling exposure until one winning close recovers all losses — but the required winning move grows exponentially with each level added.
Signal 3 — Multiple Open Trades in the Same Direction on the Same Symbol
Navigate to the Open Trades tab on Myfxbook. If an account is running a grid on XAUUSD, you may see 6–12 buy trades at different price levels all open simultaneously. This is the grid structure. If open trades are hidden, treat this as a red flag by default — there is no legitimate reason to hide open positions unless they are unflattering.
Signal 4 — Perfectly Smooth Equity Curve (Cross-Reference with Step 3)
The smooth curve is the visual result of the above three signals. Losses are not closed — they are held and averaged down. The balance rises with every basket close while the floating drawdown accumulates in the background.
Not all grid EAs fail. Some have multi-year verified live track records with controlled maximum drawdown. But a buyer who does not understand they are purchasing a grid system cannot manage the risk appropriately. For a full technical explanation of how grid execution differs from trend-following EAs at the order management level, see how forex robots work: the technical breakdown.
Step 7: Lot Size Consistency and Growth Quality
What Lot Size Scaling Tells You
The shape of the equity growth curve depends directly on whether lot sizes scale with account growth. If an EA trades 0.10 lots when the account is $1,000 and still trades 0.10 lots when the account reaches $3,000, the growth curve will be a straight line — linear, not compounding. The EA is not reinvesting gains into larger positions.
If lot sizes scale proportionally as the balance grows, the curve becomes exponential. Both approaches are valid — but understanding which one you are looking at changes how you interpret the growth percentage shown on the dashboard.
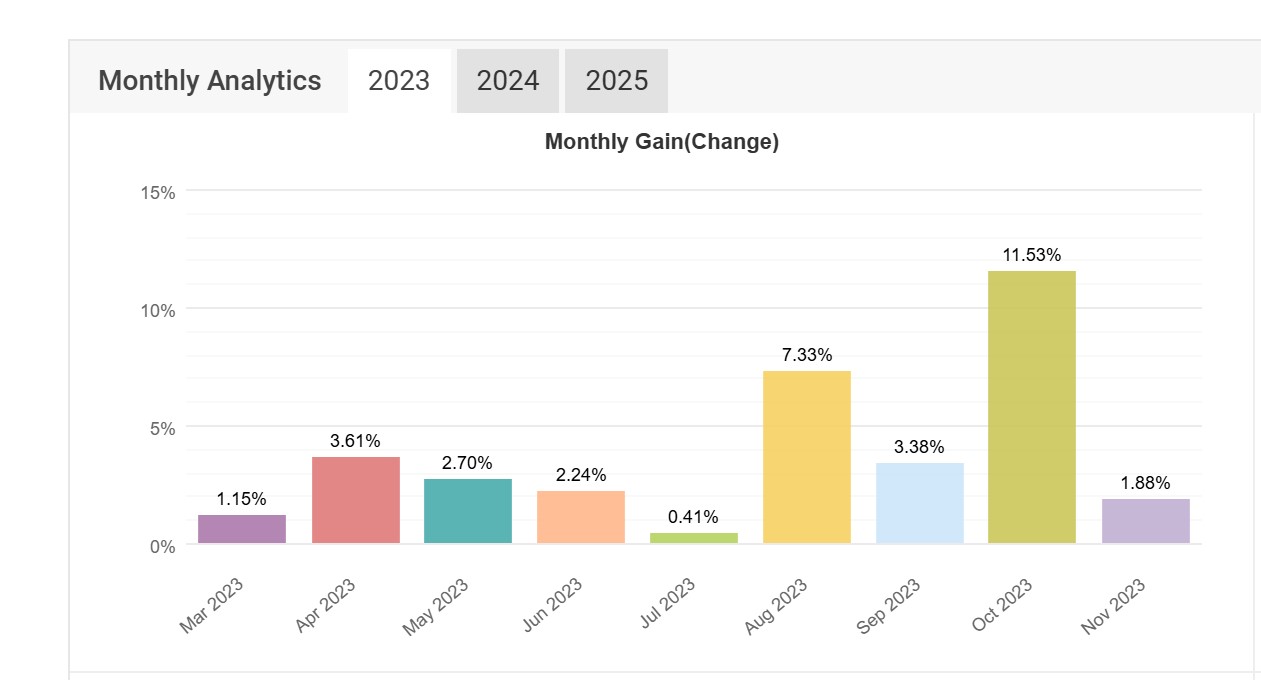
Monthly Returns Consistency
Navigate to the Monthly tab on Myfxbook. This shows a colour-coded grid of monthly return percentages. Two patterns to distinguish:
High variance: Monthly returns swing wildly — +40%, −15%, +60%, −20%. This indicates a system that occasionally hits large wins or large losses. Mathematically survivable in some cases, but psychologically very difficult to hold through. One bad month can erase several good ones.
Low variance: Monthly returns are stable and consistent — +3%, +6%, +5%, +4%, +7%. This is the profile of a system with controlled risk per trade and a repeatable edge. It compounds reliably and is easier to manage from a position sizing and reinvestment perspective.
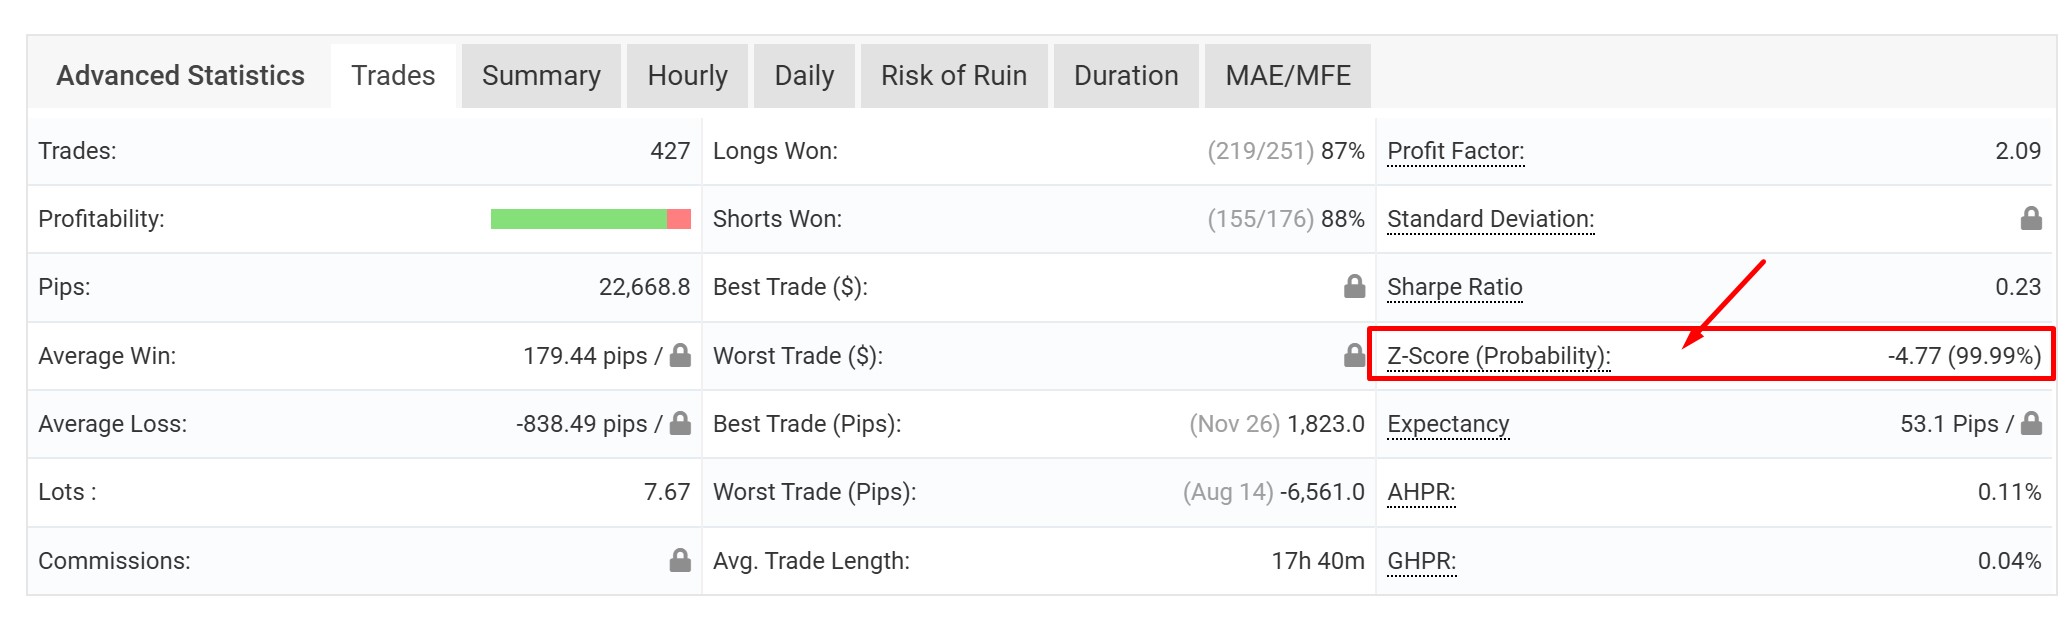
Step 8: Advanced Metrics: Z-Score, Risk of Loss Table, and Average Holding Time
Z-Score
The Z-Score is a statistical measure of whether the EA’s win and loss streaks are random or correlated. It indicates whether the system’s results are the product of an edge that is likely to continue, or simply random variance that happened to run positive.
- Z-Score between −2 and +2: Streaks are random — normal for most EAs. Results are not meaningfully correlated with prior trades.
- Z-Score above +2: Wins tend to follow wins. Momentum-style system. Results may cluster during favourable conditions.
- Z-Score below −2: Wins tend to follow losses. Mean-reversion style. The system recovers after losing streaks — which can be reassuring or can indicate position averaging.
Z-Score is contextual — it is useful for understanding system behaviour but is not a primary pass/fail metric for evaluating an EA.
Risk of Loss Table
This section of Myfxbook calculates the statistical probability of losing a given percentage of the account over a defined number of trades, based on the EA’s historical win/loss distribution. It functions as a stress test, not a prediction.
Use it to compare two EAs with similar profit figures but different risk profiles. An EA with a 5% probability of losing 20% in the next 10 trades is a fundamentally different risk proposition from one with a 35% probability of the same outcome — even if both show the same total gain percentage on the dashboard.
Average Holding Time
Average holding time indicates trading style and has practical implications for broker selection and running costs:
- Seconds to minutes: Scalper — requires low-spread ECN broker, low latency execution, VPS near broker server. Swap fees are irrelevant.
- Hours: Intraday — standard conditions. Swap rarely applies.
- Days to weeks: Swing trader — swap fees accumulate on every overnight position. For gold (XAUUSD), overnight swap can be a meaningful cost over weeks.
A gold EA with an average holding time of 17 hours accumulates swap on every position that stays open overnight. At current gold swap rates this is a non-trivial cost drag on the net return — one that does not appear in the Myfxbook gain percentage but does affect your real account balance.
Alex’s 10-Point Myfxbook Checklist
This is the checklist I run on every EA statement before considering real capital. All ten should pass before moving to demo testing. Any single failure does not automatically disqualify an EA — but it requires a specific explanation before proceeding.
| # | Check | Pass Condition |
|---|---|---|
| 1 | Verification status | Investor Password Verified on a real (not demo) account |
| 2 | Open trades visible | Open trades tab is not hidden or locked |
| 3 | Equity vs balance gap | Equity within 10% of balance — no large hidden floating loss |
| 4 | Equity curve shape | Jagged / irregular — not perfectly smooth |
| 5 | Profit factor | Above 1.3 on a track record of 200+ trades minimum |
| 6 | Average win vs average loss | Average win is at least equal to average loss (1:1 minimum, 1:2 preferred) |
| 7 | Maximum drawdown | Under 20% on balance drawdown — and equity drawdown checked separately |
| 8 | CSV Min(USD) check | Worst floating loss per trade is proportional to account balance at that time |
| 9 | Lot size scaling | Lot sizes change proportionally as account grows — or fixed lots with conscious reasoning |
| 10 | Track record length | Minimum 12 months on a live account — 24+ months preferred |
Frequently Asked Questions
What does “verified” mean on Myfxbook?
A verified Myfxbook account confirms that the trading data comes directly from a real MT4 or MT5 account via live connection — the data is not manually entered or fabricated. The strongest verification level is Investor Password Verified, which gives Myfxbook read-only access to the live account and updates automatically. However, verified status confirms authenticity only. It does not confirm the strategy is safe, that open trades are disclosed, or that the account is not running a high-risk grid or Martingale system. Always run the full checklist above on any verified account before trusting the results.
Why is the equity lower than the balance on Myfxbook?
Balance only reflects closed trades. Equity reflects balance plus the current floating profit or loss of all open positions. If equity is below balance, the account has open trades currently in a losing position. A $12,000 balance with $8,400 equity means $3,600 is currently at risk in open positions — a 30% floating drawdown that does not appear in the balance drawdown metric. Equity is the real account value. Any Myfxbook statement where equity is significantly lower than balance warrants immediate investigation before any capital commitment.
How do I detect a Martingale EA on Myfxbook?
Four signals: (1) Multiple trades closing at the exact same timestamp — a grid basket closing simultaneously. (2) Lot sizes increasing as price moves against the position — a doubling sequence such as 0.01, 0.02, 0.04, 0.08. (3) Multiple open trades in the same direction on the same symbol visible in the Open Trades tab. (4) A perfectly smooth equity curve with minimal visible drawdown — losses are being held open rather than closed. Any one of these signals alone warrants further investigation. Two or more together strongly indicates a grid or Martingale system.
What is a good profit factor on Myfxbook?
Profit factor is total gross profit divided by total gross loss. Above 1.0 means profitable. Above 1.3 is the minimum for a viable long-term strategy. Above 1.5 is strong. Above 3.0 on a short track record is often a sign of curve-fitting or an insufficient sample size — not exceptional performance. Always read profit factor alongside win rate, average win/loss ratio, track record length, and number of trades. A profit factor of 1.6 over 1,000 trades on a live account is far more meaningful than 2.5 over 80 trades on a 3-month demo account.
Can Myfxbook statements be faked or manipulated?
A fully Investor Password Verified account connected to a real live broker cannot have its closed trade history altered. However, manipulation remains possible through: hiding open trades to conceal floating drawdown, running the account on a demo server while presenting it as live, using a cent account where percentage gains look larger than real dollar exposure, or selectively sharing only a positive period while omitting a previously blown account on the same strategy. Always verify: account type (real vs demo), account currency and denomination, whether open trades are visible, and whether the track record length is sufficient for the number of trades shown.
Work my fulltime job as the developer and writer for Oreshnikbot.com now. Have been working on forex and forex EAs for 10 years.