When evaluating forex trading performance, most traders focus solely on profits. However, seasoned professionals know that understanding risk metrics is equally crucial for long-term success. Among all risk indicators, Max Drawdown stands out as the most critical measure that can make or break your trading journey.
What Is Max Drawdown and How to Calculate It
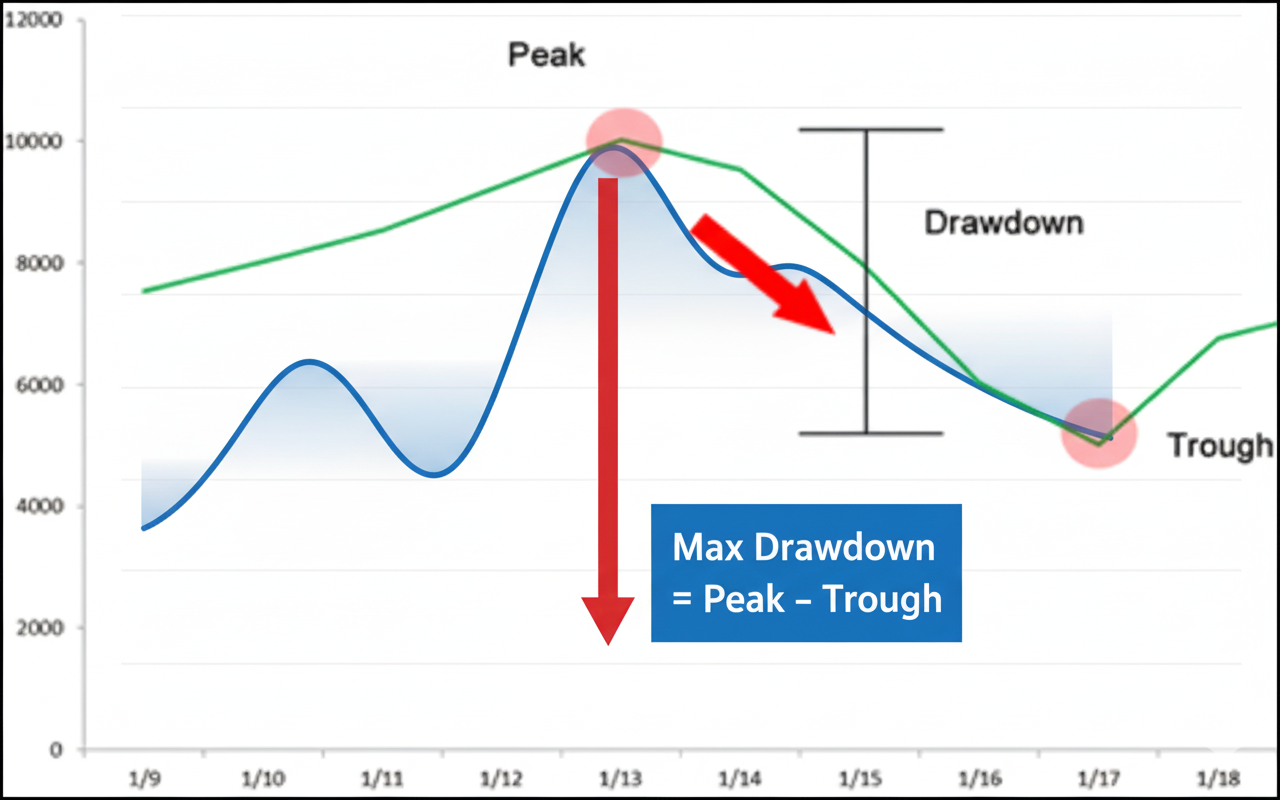
Max Drawdown (MDD) represents the largest decline in account equity from a peak to the subsequent trough during a specific period. This measurement captures the maximum loss an account experienced before recovering to new highs or continuing to decline further.
The metric can be expressed in two ways: as an absolute dollar amount or as a percentage of the peak equity value. Most traders prefer the percentage format as it provides a clearer picture relative to account size.
The Max Drawdown Formula
The calculation for Max Drawdown percentage follows this simple formula:
Max Drawdown (%) = ((Peak Equity – Trough Equity) / Peak Equity) × 100
Consider this practical example: Your forex account reaches its highest equity level at $10,000. Due to a series of losing trades or unfavorable market conditions, your equity drops to its lowest point at $7,500 before any recovery begins.
The Max Drawdown calculation would be:
Absolute Max Drawdown: $10,000 – $7,500 = $2,500
Percentage Max Drawdown: ($2,500 / $10,000) × 100 = 25%
This means your account experienced a maximum decline of 25% from its peak performance level.
Why Max Drawdown Matters in Forex Trading
Understanding Max Drawdown is essential because it directly measures the worst-case risk scenario your trading approach can generate. Unlike other performance metrics that focus on gains, MDD shows you exactly how much pain your strategy can inflict during challenging market periods.
The psychological impact of drawdowns cannot be overstated. Many profitable trading systems fail not because they’re unprofitable, but because traders abandon them during extended drawdown periods. Human nature drives us to exit strategies precisely when we should stay committed, often right before the recovery phase begins.
From a practical standpoint, higher drawdowns require proportionally larger gains to return to breakeven levels. A 20% drawdown requires a 25% gain to recover, while a 50% drawdown demands a 100% return just to reach the starting point. This mathematical reality makes drawdown management crucial for long-term survival in forex markets.
Risk management becomes more effective when you understand your strategy’s maximum historical drawdown. This knowledge helps you size positions appropriately and set realistic expectations for capital requirements during difficult trading periods.
Max Drawdown’s Role in Selecting Forex Robots
When evaluating Expert Advisors or automated trading systems, Max Drawdown serves as the ultimate reality check. A robot might display impressive profit figures, but the associated drawdown reveals the true cost of achieving those returns.
Professional money managers consider Max Drawdown the decisive factor in EA selection because it answers the fundamental question: “Can I psychologically and financially survive this system’s worst performance period?” If the answer is no, then the EA’s profit potential becomes irrelevant.
Many retail traders make the mistake of choosing robots based solely on profit percentages without considering the drawdown risk. This approach often leads to account blow-ups during the inevitable challenging periods that every trading system encounters.
The key insight is that high-profit, high-drawdown systems often fail in live trading environments because traders cannot maintain confidence during extended losing streaks. Successful forex robot selection prioritizes sustainable, moderate-drawdown systems over spectacular but risky alternatives.
Understanding Max Drawdown Relationships with Other Metrics
| Metric | Relationship with MDD | Significance |
|---|---|---|
| Net Profit | Ideally inverse: High profit with low MDD is optimal | A good strategy must generate high profits while minimizing risk |
| Profit Factor | Low MDD increases reliability of high Profit Factor | If Profit Factor is high but MDD is also high, the robot faces significant “account burning” risk |
| Calmar Ratio | Calmar Ratio = Annual Return / Max Drawdown | Most important ratio. Shows how much profit you receive per unit of risk. High Calmar Ratio indicates excellent robot performance |
Max Drawdown doesn’t exist in isolation. It interconnects with various performance metrics to provide a comprehensive view of trading system quality. Understanding these relationships helps traders make more informed decisions.
Net Profit and Max Drawdown ideally move in opposite directions. The best trading systems generate high profits while maintaining low drawdown levels. When evaluating any strategy, look for this favorable combination rather than focusing on either metric alone.
Profit Factor gains more significance when combined with drawdown analysis. A high Profit Factor accompanied by reasonable drawdown levels indicates a robust system. However, impressive Profit Factor numbers lose meaning when paired with excessive drawdown risks that could destroy accounts during adverse market conditions.
The Calmar Ratio emerges as perhaps the most valuable metric by dividing annual return by Maximum Drawdown. This ratio quantifies exactly how much return you receive for each unit of drawdown risk accepted. Higher Calmar Ratios indicate superior risk-adjusted performance, making this combination metric ideal for comparing different trading approaches.
Recovery Factor, calculated by dividing Net Profit by Max Drawdown, provides another useful perspective. This metric shows how many times the system’s total profit exceeds its worst drawdown period, indicating the system’s ability to recover from difficult periods.
Determining Acceptable Max Drawdown Levels
| MDD Level | Assessment | Recommendation |
|---|---|---|
| Under 10% | Excellent | Shows extremely tight and stable risk management |
| 10% – 20% | Reasonable and Safe | Acceptable level for most individual investors |
| 20% – 30% | Warning | High risk. Only accept if annual actual returns are very high and you have experience |
| Over 30% | Very Risky | Generally considered unacceptable for funds or serious traders. Capital recovery rate is extremely difficult |
Personal risk tolerance varies significantly among traders, but general guidelines exist for evaluating Max Drawdown acceptability. These benchmarks help establish reasonable expectations based on different risk profiles and trading objectives.
Drawdowns under 10% represent exceptional risk management and system stability. Such performance typically indicates conservative position sizing, effective stop-loss implementation, and robust market condition adaptation. These systems appeal to risk-averse traders and institutional investors seeking steady, predictable returns.
Max Drawdown levels between 10% and 20% fall within acceptable ranges for most retail forex traders. This range balances profit potential with manageable risk levels, allowing traders to maintain confidence during inevitable losing streaks while pursuing meaningful returns.
Drawdown levels from 20% to 30% enter warning territory and require careful evaluation. These systems may offer higher profit potential but demand experienced traders who understand the psychological challenges of extended losing periods. Only consider such systems if the annual returns justify the increased risk and you possess sufficient capital reserves.
Max Drawdown exceeding 30% generally proves unacceptable for serious traders and professional money managers. Such levels create extreme psychological pressure and require enormous gains to recover from losing streaks. The mathematics of recovery from deep drawdowns often makes these systems unsustainable over time.
Practical Tips for Managing Max Drawdown Risk
Effective drawdown management begins with proper position sizing relative to your risk tolerance. Never risk more capital than you can afford to lose during the system’s historical worst-case scenario. If a robot shows 25% maximum drawdown, ensure your total account can withstand this decline without forcing you to exit the strategy.
Diversification across multiple trading systems can help reduce overall portfolio drawdown. When different strategies experience drawdowns at various times, the combined effect often produces smoother equity curves than any single system alone.
Regular monitoring and predetermined exit criteria protect against catastrophic losses. Establish clear rules for when drawdown levels exceed acceptable thresholds, and follow these rules without emotion when triggered.
Consider the trading environment when evaluating historical drawdowns. Market conditions change over time, and past drawdown levels may not accurately predict future performance. Always factor in current market volatility and structural changes that might affect system performance.
The Bottom Line on Max Drawdown
Max Drawdown represents the single most important risk metric in forex trading evaluation. Whether you’re developing personal strategies or selecting automated systems, this measurement reveals the true cost of achieving profits and helps set realistic expectations for trading performance.
Successful traders prioritize capital preservation over profit maximization, understanding that surviving worst-case scenarios enables long-term prosperity. By focusing on systems with reasonable drawdown levels relative to their profit potential, you increase your chances of maintaining profitable trading over extended periods.
Remember that impressive profit figures mean nothing if the associated drawdown risk exceeds your psychological or financial capacity. Choose trading approaches that allow you to sleep well at night, knowing that even during the worst historical periods, your capital remains secure enough to continue trading and eventually prosper.
Final recommendation: When selecting Forex Robots, you should prioritize robots with low MDD that have been verified on live accounts rather than robots with high profits but unclear risks. The primary goal in investing is capital preservation.
The forex market will always present opportunities for those who survive its challenges. Max Drawdown analysis ensures you remain in the game long enough to capitalize on those opportunities when they arise.
Work my fulltime job as the developer and writer for Oreshnikbot.com now. Have been working on forex and forex EAs for 10 years.